|
|
 |
| |
|
The ReSearch Guru Standard Edition |
 |
|
|
|
| |
Multi-Column Charting
You can now view and analyze your multicolumn reports using innovative Charts.
Clicking on CHART tab on the left of the report shows a default chart. The default chart is picked by RSGuru for the top rows and columns of your report.
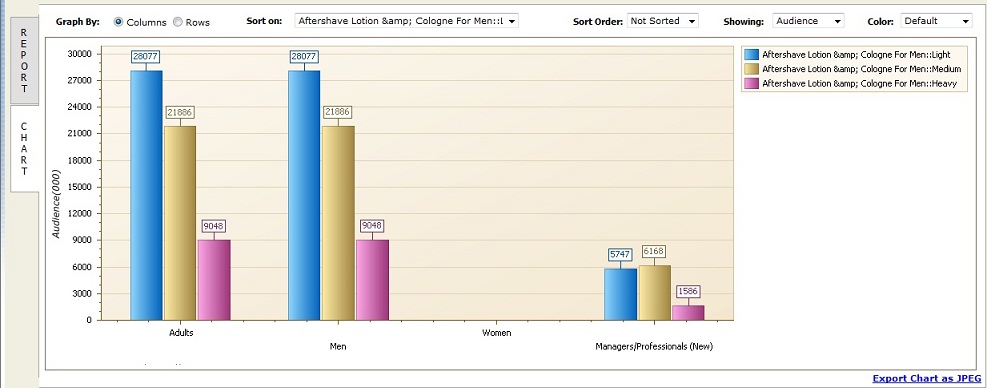
- Select Column & Rows for Charting
Add or remove the columns and rows which you want to analayze in the Chart.
Click on 'Column & Rows' button on the top of the Chart. The selection dialog will popup showing the columns and rows to be selected for charting.
- Graph By: Columns or Rows
Choose the dimension which you want to view the trend by
- Sort On
Select the item (amongst column or row items) on which you wish to sort the Chart.
- Sort Order
The default chart is not sorted. You can select the sort order on the item which you pick.
- Data Items
Select amongst all the available data items to be plotted on the chart
- Export Chart as jpeg
Allows you to quickly export the chart as a jpeg image.
- Export to MS Excel
You can export your chart to MS-Excel.
Clicking on the Export button allows you to export.
- Only the Chart
- Chart and associated report. Note: You can either choose to include only the rows & columns which are showing in the graph or choose all.
- Export to MS Powerpoint
You can also export your chart to MS-Powerpoint.
Clicking on the Export button allows you to export.
- Only the Chart
- Chart and associated report. Note: You can either choose to include only the rows & columns which are showing in the graph or choose all.
RSG exports to MS Powerpoint PPT and PPTX Formats
|
|


